OreFrame · resource estimation platform
Three modules, one platform, one orebody. Data puts the geology on screen in minutes, whatever it arrives in. VarioForge carries the estimation — variography, domains, kriging — interactively. WorkflowCanvas holds the method as a routine your whole team can read, and drives the packages the mine already pays for. One project, one truth, and an audit trail already written when the auditor asks for it.
Runs in Chrome, Edge, Firefox and Safari · nothing to install
The state of play
A resource estimate is assembled across a chain of software that was never designed to work together. Each package has its own file format, its own licence, its own interface from fifteen years ago, and its own idea of what a drillhole is. What crosses them is a geologist's reasoning about an orebody, and that reasoning is not written down anywhere.
Geological modelling in one package, estimation in another, plots in a third, cleanup in Excel, and a Python script holding the joints together. Being good at the geology is no longer enough; you have to be good at five interfaces, and the person who is has a queue outside their door.
Separate contracts, separate renewal dates, separate seat counts, separate training budgets. The graduate who needs to look at one wireframe for ten minutes cannot, because the seat is checked out in another office.
Modal dialogs, parameter files, macro languages and a manual. New staff take months to be useful and the knowledge never leaves the few people who learned it the hard way. Meanwhile the deposit does not wait.
When the report has to be signed, someone spends a week rebuilding what was done: which file, which cut-off, which search, which version. The estimate is a legal document, and almost none of what produced it was ever recorded.
So we built the layer above.
Your packages keep doing the work. OreFrame is where the geology, the method and the record live, in one interface, on one licence.
One platform, three modules
The modules are not three products bolted together. They share one project, so the domain a geologist draws in the first is the domain the second kriges and the third publishes to the mine. The canvas sits above all of it and orchestrates: it runs the steps in order, drives your existing packages, and keeps the record of what ran with which parameters.
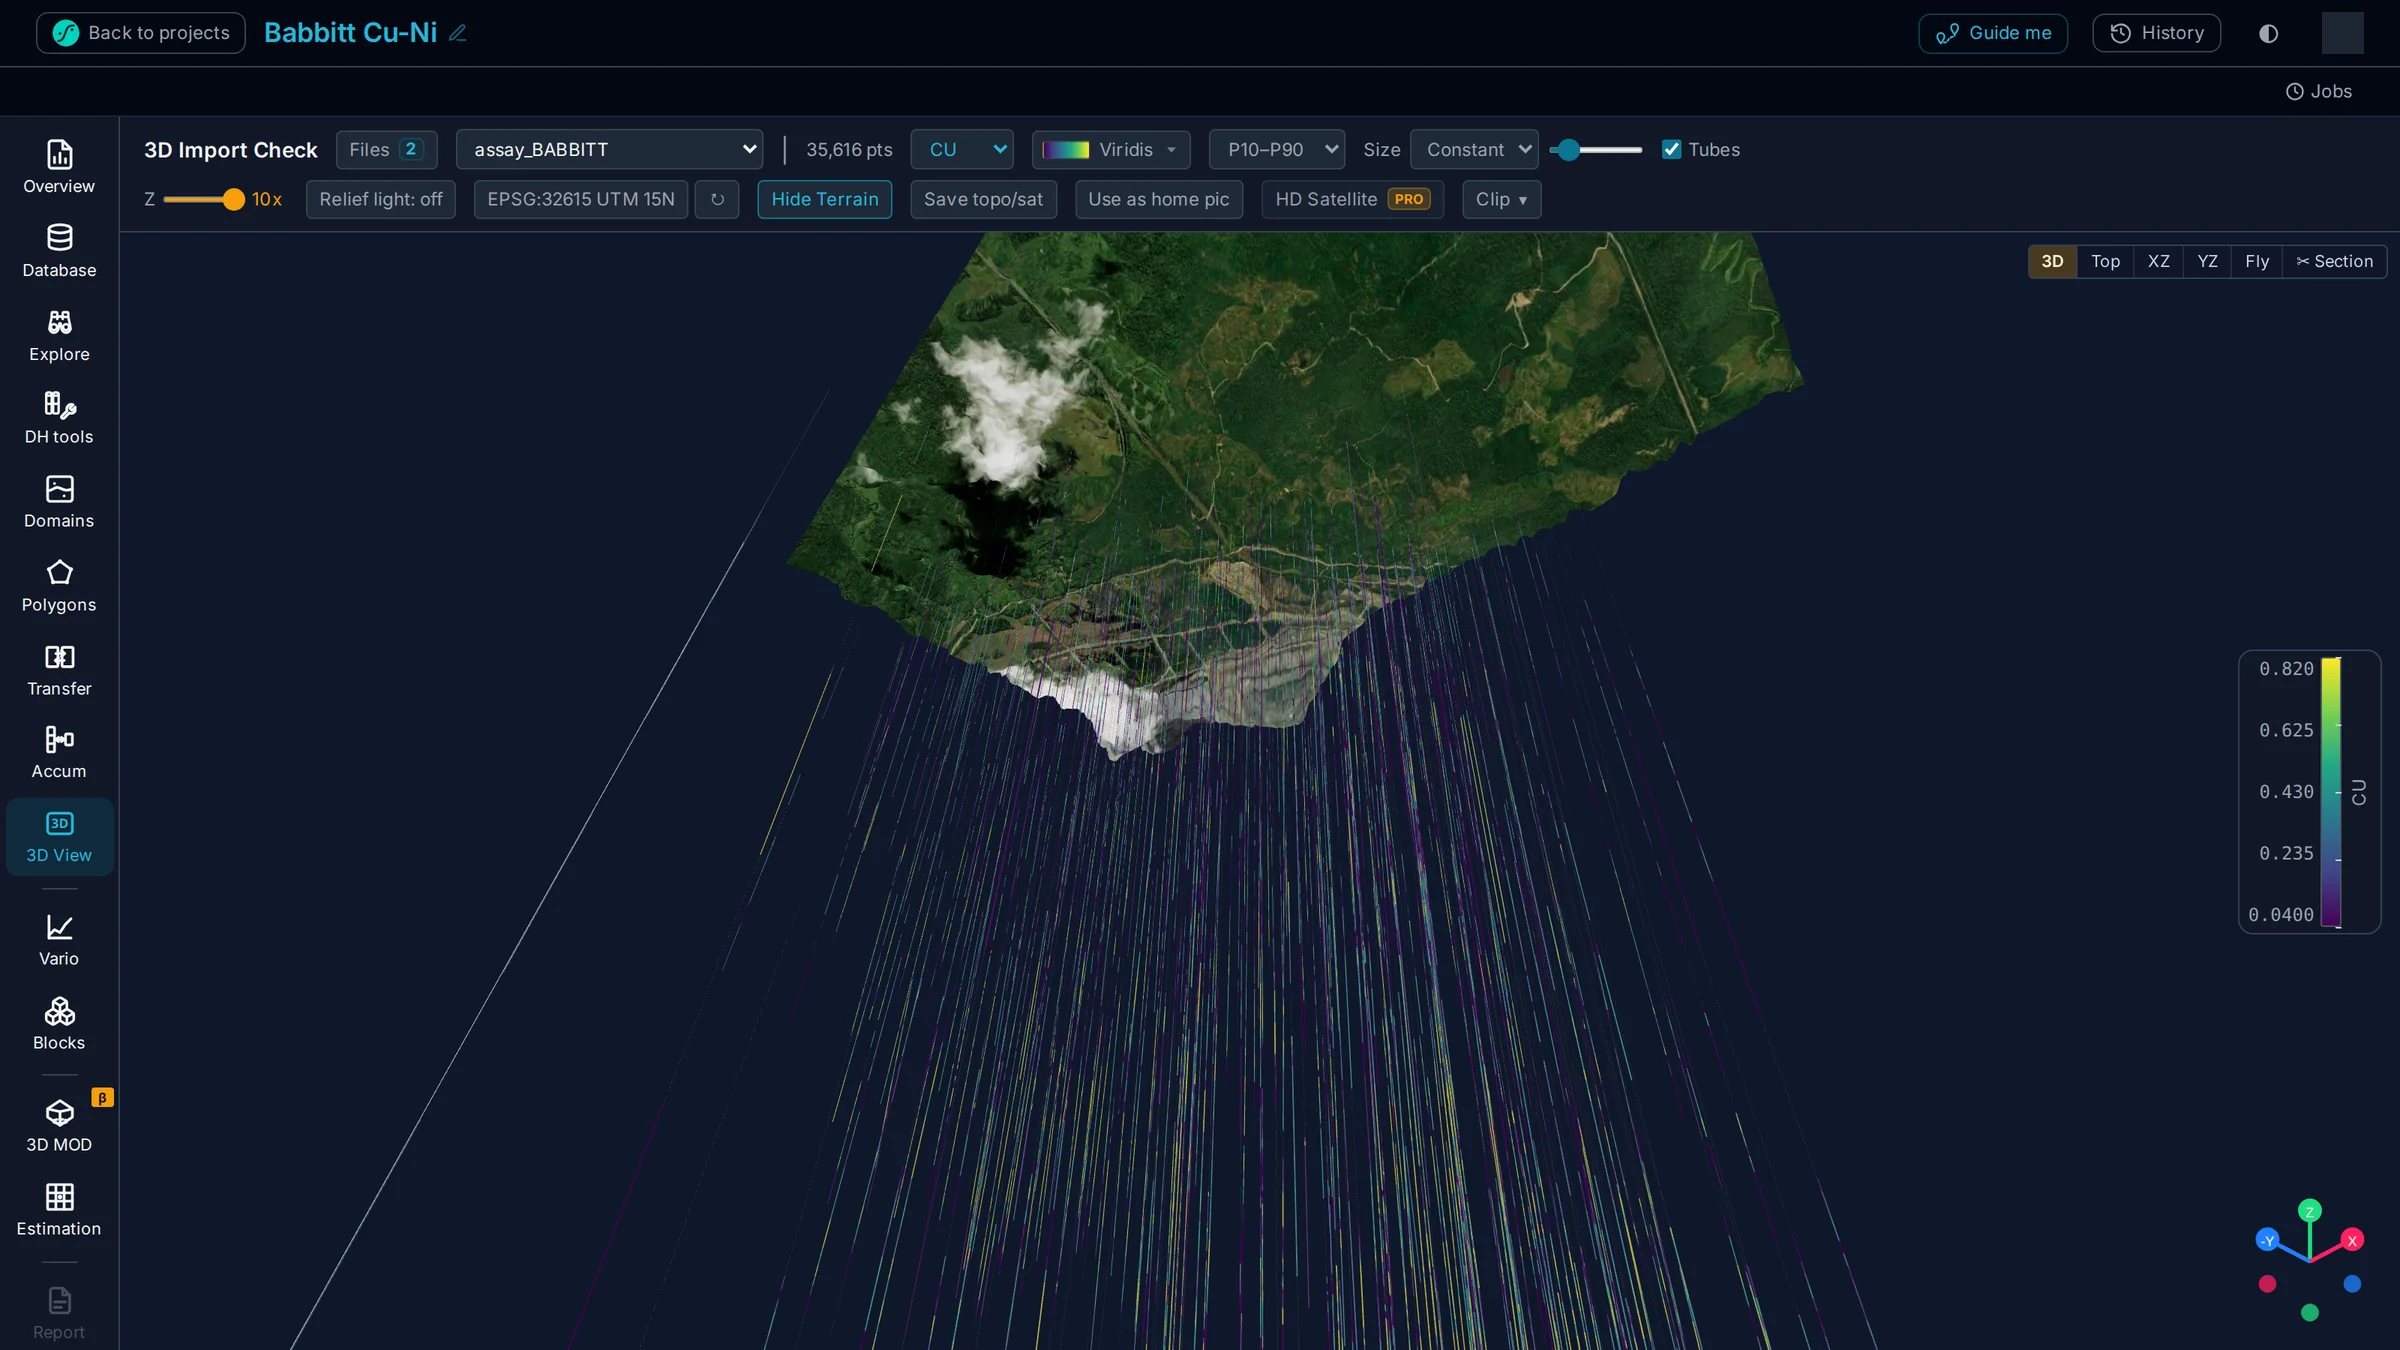
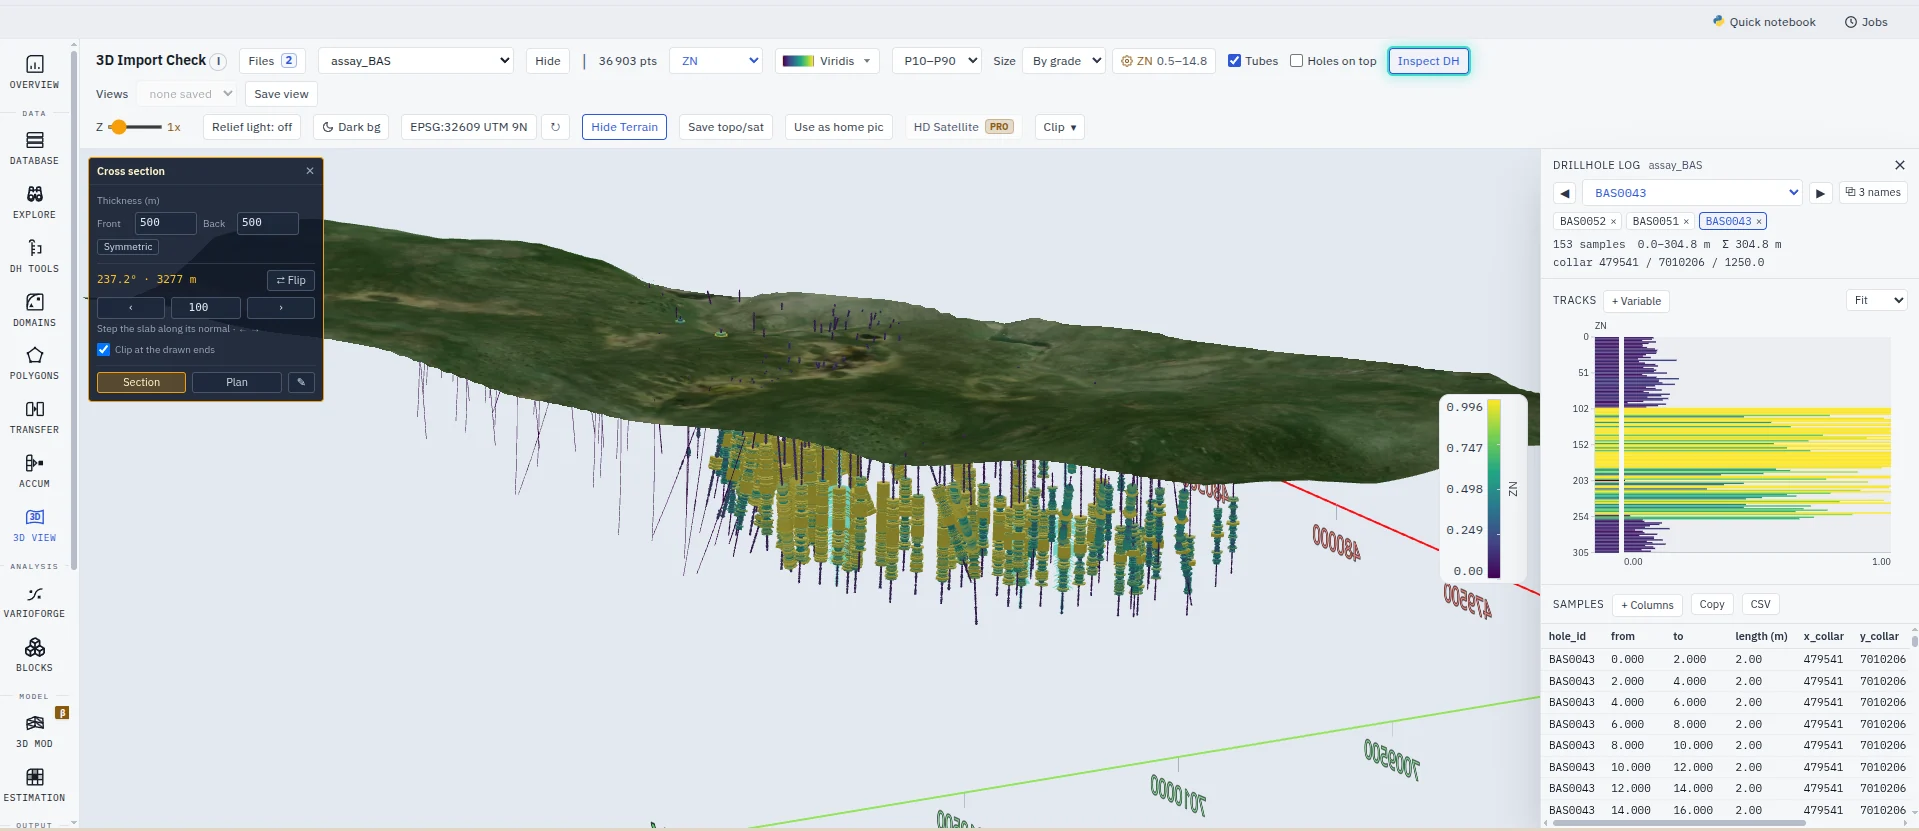
Collar, survey, assay, CSV, Excel, DXF, STL and Datamine studies read straight from disk, with desurvey, EPSG and column mapping handled on arrival. Then the deposit itself: the holes in 3D, the terrain and satellite imagery under them, the wireframes beside them, and an exploratory analysis that four variables at once does not slow down.
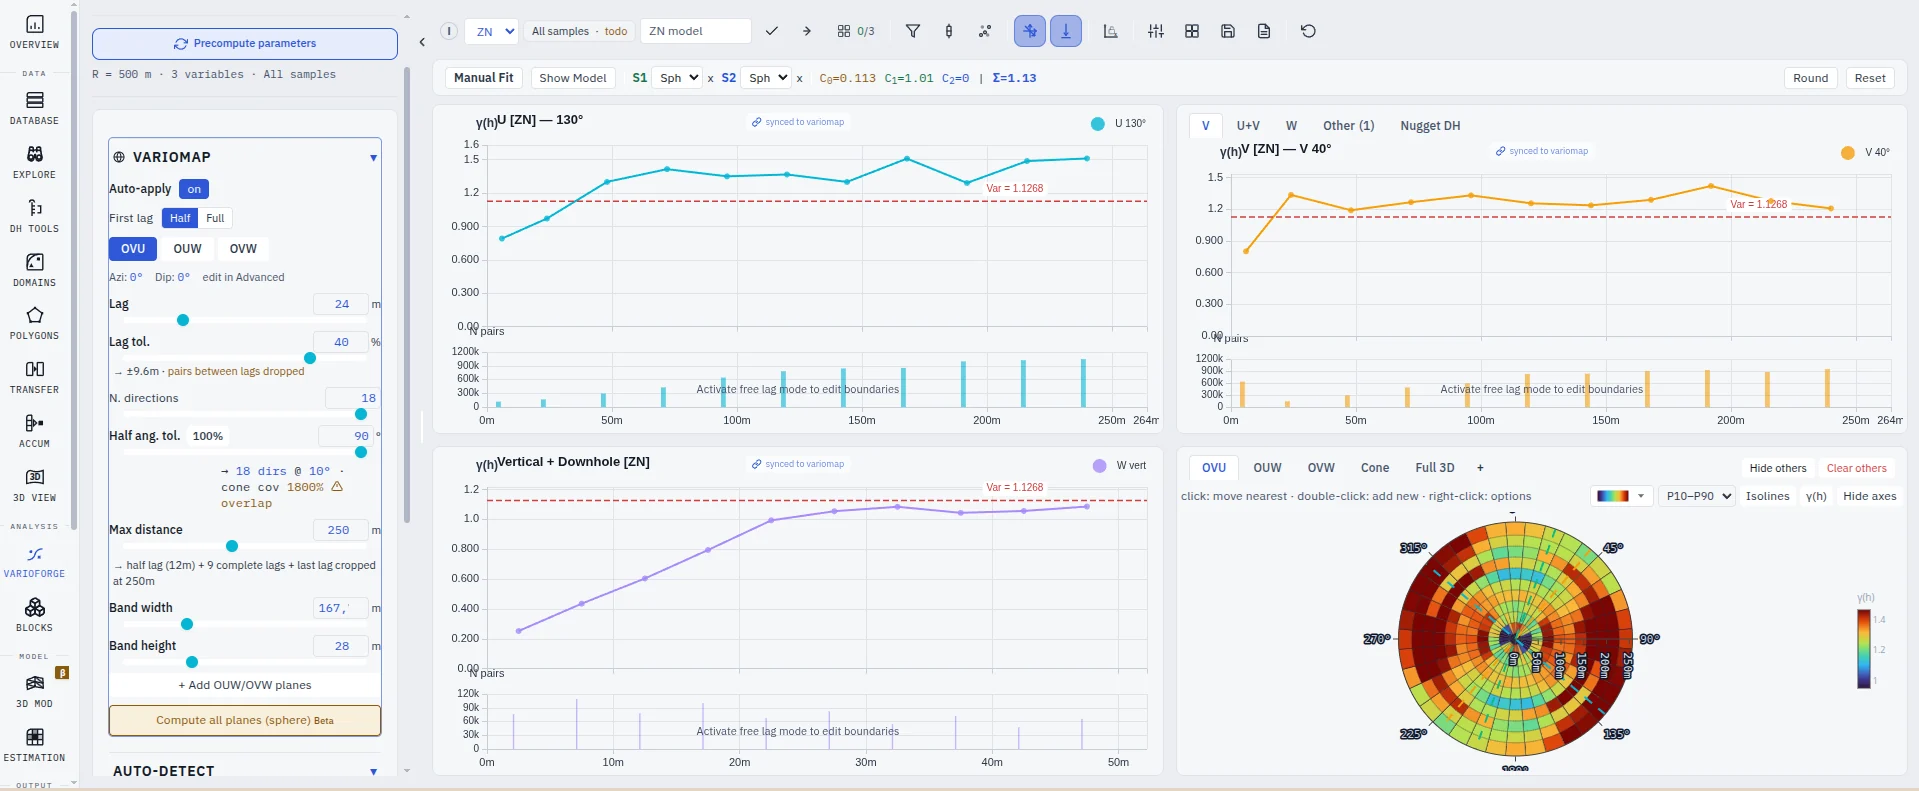
Domains, variography, block model, kriging. One variography engine built as a calculation tree: move the azimuth, the tolerance, the bandwidth, the lag, the grade or the domain and the answer is already drawn. It behaves the same on three hundred samples and on a full campaign, whatever the orebody looks like.
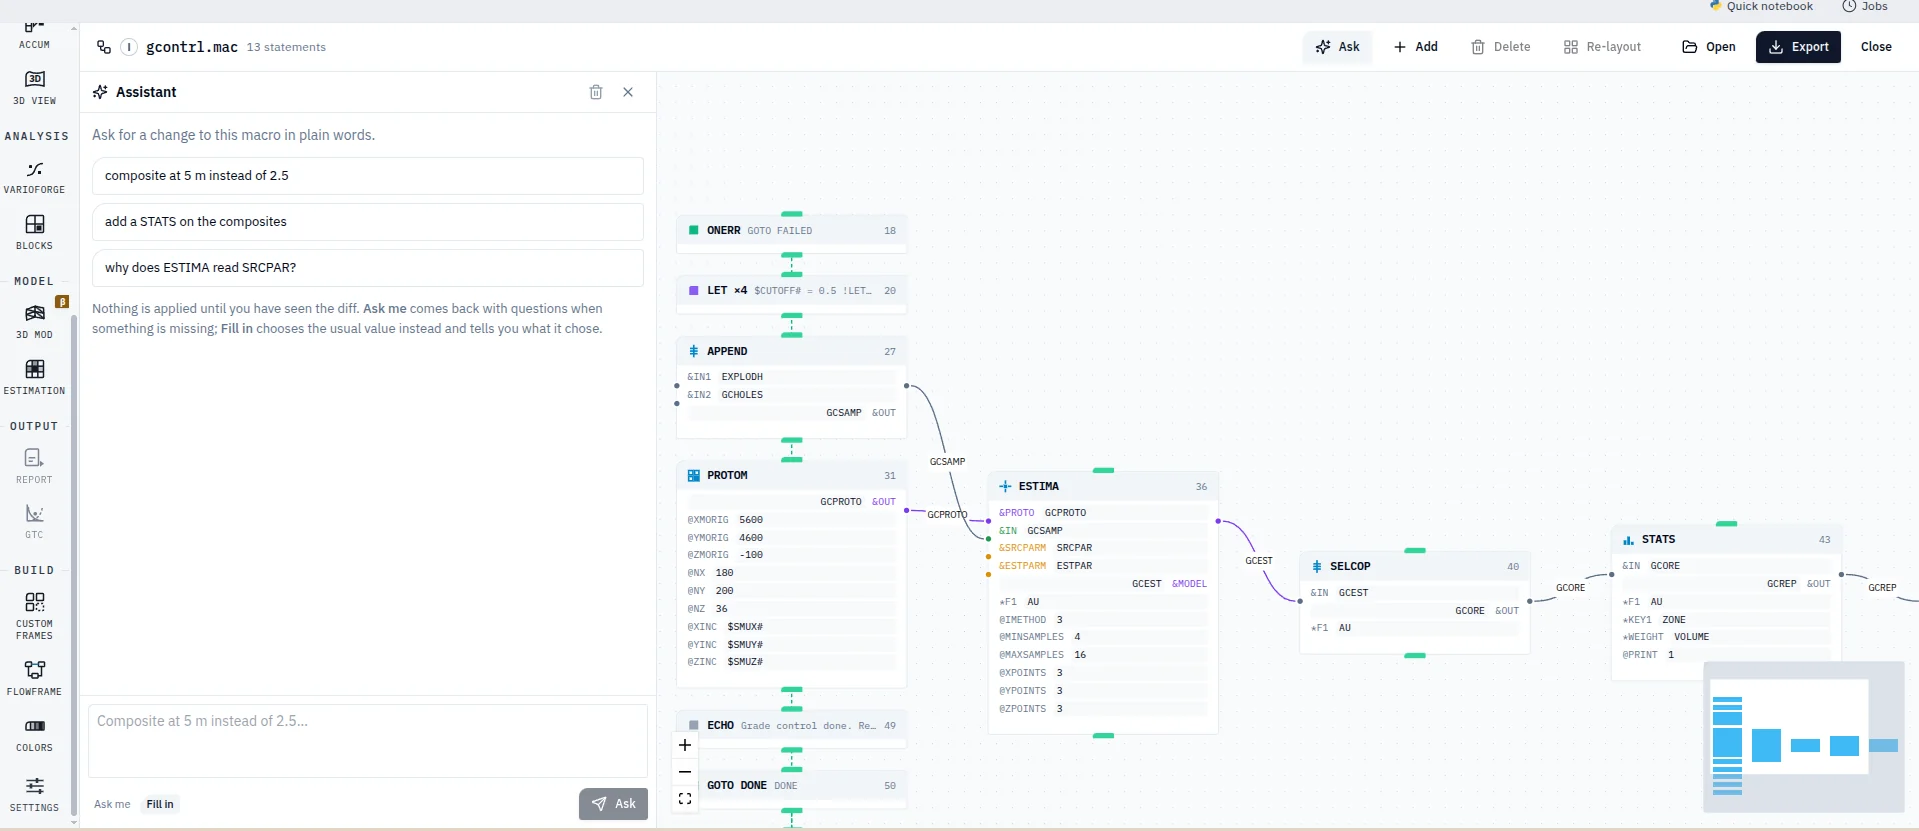
The method as a graph: nodes, typed ports, parameters on the face of each step. Run it and it drives Datamine, Surpac, Isatis, QGIS and Python in their own syntax, node by node, with the run history kept — from the resource estimate through to grade control and the monthly production reconciliation. A graduate can follow it and an auditor can review it.
What changes on Monday
No transformation programme, no eighteen-month rollout. These are the differences a team notices in the first fortnight, and they are the ones a finance director can check afterwards.
Designing a Datamine workflow — import, block model, grade interpolation, plots — took five days and now takes one, because the routine is assembled once on the canvas and driven from there instead of being re-typed step by step. The variography moves the same way: what used to be a fortnight of fitting is an afternoon, because asking for another variogram costs nothing.
Most estimation errors are not statistical. They are a wrong projection, a flipped dip convention on the survey file, a stale composite, a grade shifted by one column, a search ellipsoid typed into the second package that no longer matches the first. Nothing is re-entered here because nothing moves by hand — and where the drillholes leave a convention ambiguous, the app states the assumption it made rather than making it quietly.
Most of the people who need to see an orebody never need to model one — the mine manager, the metallurgist, the graduate, the auditor, the partner, the investor. Today each of them needs a seat of whatever the model was built in, or a screenshot. Here they open a link. The specialist licences stay where they are and keep doing the work; you just stop buying seats so that people can look.
Every step is written as it runs, with the parameters it ran with, and it exports in one action. The week normally spent reconstructing which file, which cut-off, which search and which version is a week spent recovering something that should never have been lost. It is the cheapest of the four to verify: ask to see the trail.
Module 01 · Data
Most of the delay in an estimation is not the geostatistics. It is getting the drillholes in — the right projection, the right dip convention, the grades on the right column — and then finding somewhere to actually look at the orebody. That is the first module's whole job, and it is where the geology either becomes visible or stays in a folder.
Drop three files and they sort themselves into collar, survey and assay by name. Type the source EPSG and the app tells you it is NAD27 Minnesota North in US survey feet, converts the coordinates to metres, and drops a satellite image of where your holes actually land. A projection mistake is caught in the first thirty seconds instead of in the block model.
On this trio it also reports: 100 % of 2,628 survey dips are positive → defaulted to "down = positive". It asks when it is unsure and states its assumption when it is not.
Point it at a Datamine study and it reads the
.dm
headers and tells you what each file is: drillholes, collar, survey, block
model, wireframe, variogram, variogram model, search and estimation parameters,
strings. Fields and record counts, before you import anything. You do not have to open
Datamine to know what is in the folder.
Drillholes as tubes coloured and sized by grade, wireframes and DXF surfaces in the same scene, clipping planes, a section flythrough, and the search cone drawn among the samples it actually selected. The parameters sit in the ground with the geology, not in a legend beside it.
Type the EPSG. The topography and the imagery for your licence area arrive on their own. No GIS request, no basemap licence, no waiting on another office, no cost.
Four variables at once — grades, deleterious elements, geometallurgical responses, logged lithology — as histograms, scatter and swath, all cross-filtered, with a mini-3D beside them so a selection in a histogram is a selection in the ground. The table is virtualised, carries per-column statistics, and edits persist into the project. Looking at the geology stops being a separate exercise from modelling it.
The unglamorous half
Between the drillhole file and the estimate sits the work that never appears in the technical report: regularising the samples, throwing out the collar that was logged twice, deciding what counts as a domain, drawing the orebody, and building the grid to put it in. It is most of the elapsed time on a resource estimate, and in most companies it is spread across three packages and a spreadsheet. Here it is one continuous set of tools over one project.
Composite to a fixed support, with a mass-balance report that tells you what the regularisation cost you. Remove duplicated samples and collars. Create a variable. Aggregate to the hole head, or push a collar value back down the samples. Clip against a surface, or select on a bench polygon.
Build domains from rules on any variable — lithology, alteration, weathering profile, a grade threshold — or let the grade shell take the longest mineralised run in each hole and hand you a first pass in one click. The automatic answer is an editable starting point for a geologist, never a boundary you have to accept.
Contour a domain in plan. Build a 2.5 D sheet from a centreline and a thickness, with the border continuing the local dip instead of flattening to the mean. Or run implicit modelling — a compactly-supported RBF and an iso-surface — for a grade shell in three dimensions. Stack the surfaces into a deposit model, and export any of it as DXF.
Marked honestly: live means it is in the product, next means the engine exists and is covered by the same test suite as the rest but is not yet open to every account. The chain further down draws the same line.
Onboarding
The reason people stay on the old software is rarely that it is better. It is that somebody spent two years learning it and nobody wants to spend two more. So the guide here runs inside the real product, on your own study, in chapters you choose — not a PDF, not a sandbox demo, not a two-day course somebody has to fly in for.
The tour walks the study you actually have — your 3D view, your variograms, your data table. A new geologist learns the deposit and the software in the same hour instead of transferring lessons from a fictional dataset afterwards.
The full path from an empty project through import and desurvey, or a short walk through the study in front of you. Nobody sits through the part they already know, which is the reason most in-app tours get dismissed on the first screen.
Walk the path once with your own conventions and your own domains, then send the team down the same one. Induction stops being a document somebody has to keep current and becomes the product itself.
Module 02 · VarioForge
Underneath VarioForge is a calculation tree rather than a recompute. Move the azimuth, the tolerance, the bandwidth, the lag, the grade or the domain and the curve is already redrawn. It behaves the same on three hundred samples and on a full drilling campaign, and on any variable you point it at — grade, deleterious element or geometallurgical response. That is why an estimation stops being a budget of minutes per test.
When a variogram costs nothing to ask for, the question changes. It stops being "which variogram do we have time to fit" and becomes "which reading of this orebody survives". Chain a domain against a variable, look, change the domain, look again. Four grades against three domains is an afternoon, not a fortnight — so the geologist tests the interpretation they would otherwise have had to assume.
Geology, not charts
Most packages draw the result in 3D. Drawing the parameters in 3D, the cone that accepted the pairs, on the holes that produced them, is what turns a review meeting from an argument about numbers into a conversation about geology.
Build the block model inside the wireframe, sub-block it, set the search neighbourhood and run ordinary kriging on the structures the variography just produced. The same fitted model, not a set of numbers retyped into another package — for every variable the mine needs estimated, not only the payable one.
The experimental variogram, the four model types and the kriging system are asserted against independent reference implementations on every release, rotated anisotropy included. Ask for the test suite during a technical review and we hand it over.
The block model rendered inside the DXF volume it was constrained by, blocks sized and coloured by grade, turning in the same scene as the holes. Assembling the deliverable and reviewing it are the same act.
opening progressively
Module 03 · WorkflowCanvas
This is the part people do not expect. OreFrame does not only read your packages' files. It writes their work. Assemble the routine from templates on the canvas and it emits the macros and scripts those packages run, in their own syntax, then executes them in order and tells you where it is. The reasoning about the orebody moves out of one person's head and into a graph the whole mine can read — the annual resource estimate, but also grade control and the monthly production reconciliation that follow it.
A routine can cross five packages in one run: database to QGIS to Python to Isatis to Leapfrog and back, with conditional branches driven by global variables, so the simulation runs only when the flag is set. Progress is tracked node by node and the run history is kept — which is what makes a routine safe to re-run every month against fresh production data rather than rebuilt each time.
234 for Surpac, 100 for Datamine, 90 for RMSP, 69 for Isatis, plus Python and QGIS, across block modelling, estimation, variography, compositing, DTM, blasting and underground design.
libraries live · browser being finished
Ready-made routines for nickel laterite with weathering-profile domains and moisture and density, orogenic gold with indicator kriging and heavy top-cutting, porphyry copper with alteration zones and net smelter return, and BIF iron with Davis Tube recovery and product classification. Open one, change what your orebody does differently.
Every action in the study is recorded as a node: the import mapping, the composite length, the domain rule, the fitted structure, the search ellipsoid. Not a log file beside the model. The graph is the model's provenance, and it is the same object the canvas opens.
The licence you already pay for, driven by a routine your whole team can read.
Nobody has to learn the macro language to get the deliverable.
One source of truth
A model repository versions files. This versions the method. The drillholes, the composites, the domain rules, the fitted structures, the search ellipsoid and the routine that produced all of it sit in one project with one history. Nobody has to look in a folder, and nobody has to ask the person who ran it.
Which is what makes the audit quick. The week somebody normally spends rebuilding what was done — which file, which cut-off, which search, which version — is a week spent recovering a record that should have existed. Here it did exist, from the first import onward, and it exports in one action.
Assisted analysis · Python and language models
Every mining company is having this conversation right now. The tools are useful, the staff are already using them, and the governance question has no good answer yet. Our position is that the answer has to be architectural — a policy asking people not to paste a grade table into a chat window is not a control, and everyone in the room knows it. Below is what runs today, what we have committed to build, and what comes after.
Today · running
Model-written Python is genuinely useful in a geostatistics workflow, and your team is already running it. Here it executes on an isolated machine holding no credentials, on its own private network, serving one tenant at a time.
Committed · not built yet
The design we have committed to, and the one we will be judged on: the assistant works on the structure of a study, never on its contents. Hole names, coordinates, grade values and variable names are substituted before anything crosses the boundary, and the result is mapped back inside your session.
Stated here because a buyer deserves to know our position before the procurement call, not because it ships today. Ask for the design note and hold us to it.
Next · where this goes
The generic assistant has read the internet and knows nothing about your deposit, your domains or your reporting standard. The useful one is grounded in the material your team already produced — and it is governed like any other access to that material.
roadmap — nothing in this column is shipping today
What you actually get
Drillholes, composites, domain rules, fitted models, search ellipsoid, block model,
and the lineage that produced them, inside one project. Not a folder of
final_v3_REVISED
beside a spreadsheet of parameters beside a document explaining both. There is one
answer to "what is the current model", and it is the project.
Invite by email, or send a link that expires on a date you choose. The other person opens the project, so there is one model, and revoking access is one action rather than an audit of who has which zip. Every row and every stored file is scoped to its owner in the database, not by the app remembering to check.
Build the routine as nodes with their parameters visible on them. A graduate can follow it. An auditor can review it. The next geologist can change one parameter and see what depends on it. A macro is correct and unreadable; a graph is reviewable by the person who has to sign the report.
Model-written Python runs on a machine with no credentials, on its own private network, one tenant at a time, with a token minted for that machine alone. Provider keys never reach the browser and spend is capped per user. The worst case is code reaching data you uploaded yourself, and every run is recorded in the study's graph. How that works ↓
One project, end to end
Nine stages, one project, one orebody. The drillholes, the parameters and the lineage live inside the study, not in a folder someone can move.
We would rather show you the line than blur it. Stages 05 to 09 exist in the codebase and are covered by the same validation suite as the rest, compositing checked for mass balance and ordinary kriging against a reference implementation, but they are not yet open to every account. Stage 07 is being rebuilt around an editable ribbon interpretation, so it is marked in dev rather than promised.
Straight answers
The screenshots on this page are a 399-hole, 35,616-sample drillhole study, and the variography on it is immediate. The engine is built so that the size of the campaign changes what happens underneath rather than what you experience. Bring your worst dataset to the technical review; that is the honest way to answer this one.
Ask for the test suite during a technical review. The experimental variogram, the variogram models and ordinary kriging are asserted against independent reference implementations on every release, rotated anisotropy included. We would rather hand that over than argue about it.
Safer here than in the arrangement you have now, which is people pasting into a chat window. Model-written Python runs on a machine with no credentials, on its own private network, one tenant at a time. The worst case is code reaching data you uploaded yourself. And it lands in the study's graph, so you can read what it did.
Good, that is the point. OreFrame does not ask you to leave them; it drives them. The routine is assembled on the canvas and comes out as macros and scripts those packages run, so the licence you already pay for keeps doing the work while the method becomes something your whole team can read.
Be precise with us and we will be precise back. Part of the work runs on the engine, so the samples reach it; the interaction runs in your browser and reaches nobody. Where the engine lives is a deployment question, and on-premise is a normal conversation.
A small team that answers. Your variogram models leave in the formats your estimation package already reads, your geometry leaves as DXF, and your workflow leaves as a JSON graph. Nothing here is a hostage.
Where the line is
This audience checks. So here is the honest state of the product rather than a feature matrix with everything ticked.
Assisted analysis is deliberately not in this column. What runs, what we have committed to build and what comes after are set out in full above.
The wider stake
The Critical Raw Materials Act, adopted in March 2024, sets 2030 benchmarks for the Union's own capacity: 10 % of annual needs extracted, 40 % processed, 25 % recycled, and no more than 65 % of any strategic raw material coming from a single third country. In February 2026 the European Court of Auditors warned that many of the strategic projects meant to deliver that are likely to miss the date.
A permit, a financing round and a public-interest designation are all granted against a resource statement. The bottleneck is rarely the geology. It is how long the statement takes to produce, and how much of the reasoning behind it can actually be shown to the regulator and the investor who are asked to rely on it.
There are not many people who can carry an orebody from drillhole to signed model, and the ones who can are already busy. A method that lives in a graph rather than in one person's macro is a method a second person can run, and a graduate can learn from. That is a capacity problem being solved, not a licence being sold.
This comes out of New Caledonian nickel — one of the two French overseas mining territories, alongside gold in Guyane — where estimation is a daily industrial practice rather than a research topic. The intent is to export the expertise rather than the ore, and the same tooling applies to any deposit anywhere.
Mineral sovereignty is decided one resource statement at a time.
Making those statements faster to produce and harder to argue with is not a productivity feature. It is the constraint.
Bring one dataset
No procurement cycle, no install, no two-day training course. Load a collar / survey / assay trio from a deposit you know well, take a direction off the variogram map, and see how long it takes you to test the interpretation you have been putting off.
contact@oreframe.com